Three Steps to Finding Under-Priced Properties in Your Market
One of the most important measurements in real estate investing is “price per square foot.”
The price/sqft measurement is not only critical for determining the after repair value (ARV) when wholesaling, flipping houses, rehabbing, and doing new construction but it’s also one of the best measurement for finding underpriced potential deals.
I’ll explain but first let’s review how to determine price/sqft and why it’s so important.
Price/sqft allows you to analyze data in a given market by converting everything to the same unit of measurement (comparing apples to apples).
For example, let’s take a specific market called “Meyers Park” in Charlotte, NC (I recently did a fix and flip deal there). Let’s suppose there are 5 homes that recently sold for the following prices:
Home 1: $710,000
Home 2: $817,000
Home 3: $775,000
Home 4: $939,000
Home 5: $954,000
What does this data tell is? One could argue that the average sold price of homes is $839,000 (add up all 5 and divide by 5 to get the average) but here’s the issue…each of those 5 homes is different and price alone doesn’t help us understand the market.
Now let’s add one more piece of information. Let’s also suppose that the total living square footage for each sold home is:
Home 1: $710,000 2,900 sqft
Home 2: $817,000 3,300 sqft
Home 3: $775,000 3,100 sqft
Home 4: $939,000 3,880 sqft
Home 5: $954,000 3,700 sqft
Now what does this additional data tell us? We know the average sqft of these 5 sold comps is 3,376 (add up all 5 and divide by 5 to get the average), but we still can’t accurately analyze this data because each home was different in size and sold for different amounts.
Let’s take it one more step and determine the sold price per square foot (sold price/sqft) of each sold home by dividing each sold price by it’s sqft. (sold price / sqft = price/sqft)
Here are the results:
Home 1: $710,000 2,900 sqft $243/sqft
Home 2: $817,000 3,300 sqft $248/sqft
Home 3: $775,000 3,100 sqft $250/sqft
Home 4: $939,000 3,580 sqft $262/sqft
Home 5: $954,000 3,700 sqft $258/sqft
Now what does this additional data tell us? Well, now we can actually compare these homes on the same playing field because we’ve determined the value of each sqft for each home. So for example, the value of each sqft in home 1 is $243.00. The value of each sqft of home 5 is $258.00 and so on.
The average price/sqft of these 5 sold homes is: $252.00.
 This is the most important data we can gather and learn about a particular market. Here’s why…lets say I find a potential deal in that same neighborhood that is 3,000 sqft and as part of analyzing the deal, if I were to buy this property, I need to know what I could sell it for once it’s fixed up (ARV).
Well if I know that on average homes sell for $252/sqft, I can quickly multiply the average price per sqft by the sqft of my potential deal like this:
$252 average sold price/sqft x 3000 sqft of potential deal = $756,000 ARV
So now I know that based on my research of sold comps, I should be able to sell that 3,000 sqft home once fixed up for $252/sqft or in other words $756,000.
Price per sqft now becomes the best unit of measurement for understanding markets. Since I do deals all over the U.S., the first thing I want to learn about any particular market is the price/sqft for sold homes in that market. Everything starts there.
I use the same measurement for my new construction projects. The key question you must consider before you ever think about flipping houses is:
“What is the price per sqft that I can sell
this property for once I make improvements?”
Once you know that number with as much certainty as possible, you can figure out everything else to know if the deal makes sense.
Why Price/Sqft is The Most Important Measurement for Real Estate Investors:
Now let’s talk about how to use price/sqft measurement for finding deals. When it comes to farming for deals in any particular market, it can quickly become overwhelming looking at all the available inventory (homes for sale) to determine which ones might be potential deals. I say “potential” because we don’t know if a property for sale is a deal until we analyze the numbers and figure it out and even then, it’s never a deal unless we can buy it for the right price.
However, there is a way to use price/sqft to sift through all of the available properties for sale to determine which ones are priced the most aggressively to sell. In other words, which ones are “under-priced” indicating a motivated seller and therefore more likely to be a potential deal.
To put this in context, let’s say there are 100 properties available for sale in your market. Out of the 100, which are the top 10 best-priced properties? Remember, the actual price is not what’s important. It’s all about price/sqft. (I’m not going to stop saying that until it sinks it and you never talk about price ever again, only price/sqft!)
Here’s how to find the most under-priced properties...
Using the same example as earlier, if the average sold price/sqft is $252, then technically any property for sale that is below $252/sqft would be considered a potential deal. Why? Because it’s for sale below the average price that homes have recently sold for making it under-priced. Read that again if it doesn’t make sense.
For example, let’s say there is a property in our example market (Charlotte NC) and it’s for sale for $752,000 and it’s 3,200 sqft. Using price/sqft we know that it is for sale for $235/sqft ($752,000 / 3,200). So since we’ve already determined that the average sold price is $252/sqft, this property is under-priced and is worth taking a closer look as it now qualifies as a potential deal. In fact it is precisely for sale 7% below the market average because $235/sqft is 7% lower then $252/sqft.
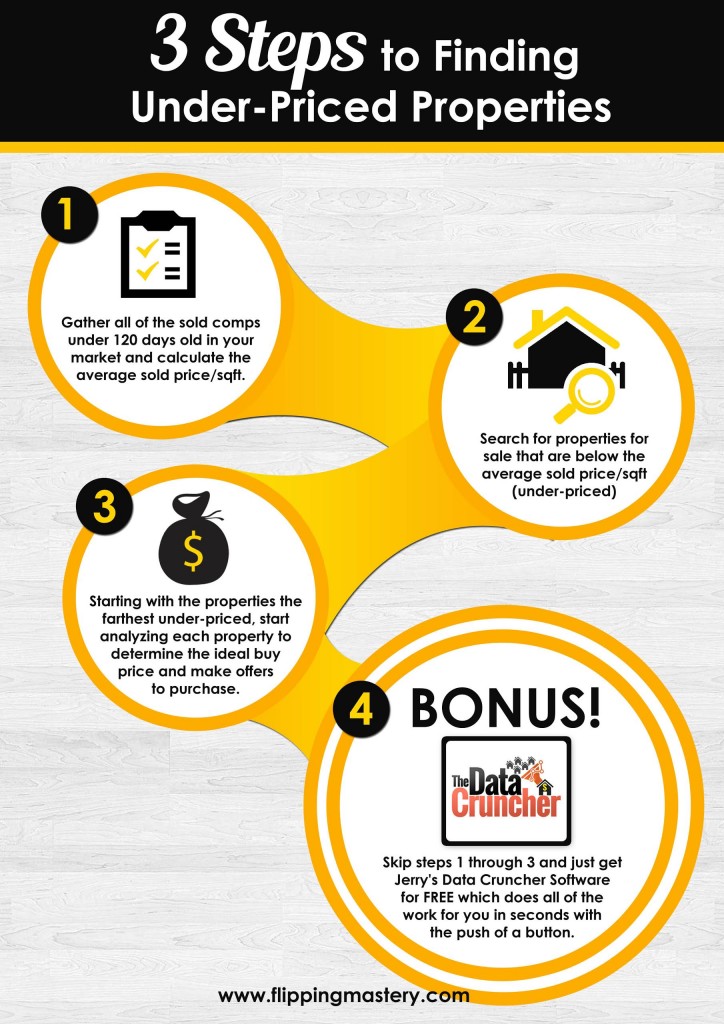
Let’s take a look at the 3 steps for finding under-priced properties using price/sqft:
Step 1: Determine the average sold price/sqft in a particular market:
“Market” can be defined as neighborhood, city, school district, etc., but I like to use zip code. In the example above we used just 5 sold comps. I recommend using as many as possible to get a more accurate average. Age of sold comps is another consideration. If you are gathering enough data, up to 120 day-old sold comps are sufficient. Keep in mind, the newer the sold comps the better (i.e. Using 30-day old comps are more accurate then 120-day old comps).
Some websites such as trulia.com have already calculated the average sold price/sqft in certain markets. This can save you a ton of work. Otherwise you will need to calculate the data yourself which means you will need to gather all the sold prices and corresponding square footages for each comp and then divide accordingly to get the price/sqft and then divide by the total number of comps used to get the average.
a). Sold Price of Comp / total living sqft = sold price/sqft
b). Total of all price/sqft / total number of comps used = average price/sqft
Step 2: Determine Active Listing Below the Average Price/Sqft:
Once you determine the average sold price/sqft, the next step is to narrow down all the properties for sale that are listed for sale below the average price/sqft you determined in step 1. This is now your list of under-priced potential deals.
Step 3: Analyze the Under-Priced Properties:
Start analyzing each under-priced potential starting first with the properties that are the most under-priced or in other words the farthest below the average sold price/sqft. Once you determine your buy price, make offers immediately.
FREE Software Does it For You!
Now, here’s the good news…I created software that does all of this for you literally in seconds at the push of a button. I call it The Data Cruncher Here’s how it works. Based on the zip code you input, it scans all of the recent sold properties and determines the average sold price per sqft. Then it generates a list of all the properties for sale under the average. It even gives you the percentage below the average so you know which ones are the most under-priced. And finally, you can click on each property for more information so you can quickly analyze them and make offers.
The best part is its super easy to use! All you do is enter the zip code and press enter. That’s it! Check out how simple it is:
Data Cruncher Quick Demo Video:
This is definitely something you want to start using to help you find good deals. Click here to test it out in your zip code and see how many under-priced properties are for sale. Remember, these are potential deals that you may miss out on if you don’t act fast.
When it’s all said and done, understanding how to use price/sqft for not only analyzing deals but for finding under-priced properties will make you a smarter and more successful investor and most importantly, make you more money!
Leave a comment below and promise me you will never compare prices again but instead will only use price/sqft. Also let me know how you like the Data Cruncher software.
Until Next time, Happy Investing
Jerry Norton
Click here to get a FREE copy of Jerry’s best selling eBook, How to Make a Million Dollars a Year Flipping Houses.